Iot Observability With Rsyslog Loki
Logs are an indispensable component of software development, debugging and troubleshooting, serving as a crucial source of information and insight into the inner workings of an application or system. This was no different, when I was trying to debug the issue with Car presence detection stops reporting metrics randomly.
Microcontrollers are designed for resource-constrained environments where memory and processing power are often at a premium. Implementing logging on a microcontroller with only 2-4mb flash memory (this is where the application also needs to run) is also almost impossible. However, the issue I was encountering Car presence detection stops reporting metrics randomly was difficult to debug without some sort of logging because:
- The issue was random - it could take from few minutes to days for the metrics to stop reporting
- I had serial.print() statements, however to view those, I had to connect my laptop to the microcontroller (on the micro usb port). The microusb port on the microcontroller is also used for powering up the microcontroller. This would mean, if I had to connect the laptop, it would result in microcontroller getting restarted and the issue resolving (for atleast sometime).
I had to find a way to get insight into my code when the issue was happening. In this article, I will be covering how to get log files for application that is running in a memory constrained environment i.e. microcontroller.
TABLE OF CONTENTS:
ARCHITECTURE:
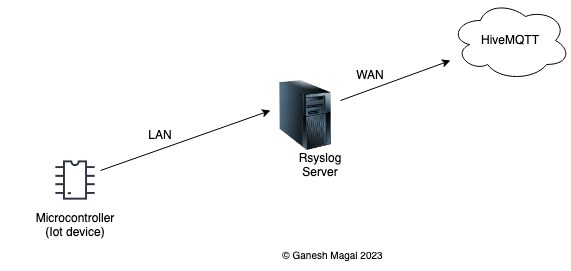
Microcontroller is bascially the IoT device which is running the application which you are interested in debugging.
🔝
RSYSLOG:
Rsyslog is an open-source software which is used for processing logs. Applications can redirect logs to Rsyslog which is a centralized log management software. I installed rsyslog on a Raspberry Pi that is running locally on my home network.
Step 1:
Run the below command on the host where you want to install rsyslog:
sudo apt install rsyslog
Step 2:
We will need to modify the rsyslog configuration file to allow the rsyslog server to listen to udp and imudp ports for log ingestion:
sudo nano /etc/rsyslog.conf
Uncomment the below 4 lines (should look like below after uncommenting):
module(load="imudp")
input(type="imudp" port="514")

module(load="imtcp")
input(type="imtcp" port="514")
Step 3:
We will next have to create a config file which defines the template. The template dictates what type of logs, and from which host the rsyslog server should ingest logs.
Navigate to /etc/rsyslog.d and cerate a file (ending .conf) in that location.
sudo nano /etc/rsyslog.d/pico.conf
Next, we will have to define the template, copy and paste the below content into pico.conf file that we created above:
template(name="pico" type="string" string="/var/log/pico.log")

if $fromhost-ip startswith "192.168.0.23" then -?pico
& stop
This template creates a log file named pico.log under /var/log/ as soon as the host with IP address 192.168.0.23 starts sending logs to rsync server. If you have multiple host, you will need to create multiple *.conf files at this location - /etc/rsyslog.d and add similar templates.
Step 4:
Next restart the rsyslog server:
sudo systemctl restart rsyslog
The rsyslog server is configured and will start ingesting logs that are received from the host which we defined in the template conf file above. The location of the log files in the rsyslog server will be /var/log/ and the log file name will be pico.log which we defined in the template conf file. Here you can view the logs which will be pushed by the microcontroller (it can be any host).
🔝
PROMTAIL:
I wanted to take the logs from the locally hosted rsyslog server to Grafana Loki. Grafana Loki is also an open-source centralized log aggregation and management system which couples with Grafana and enables log querying, visualization, and alerting. So I decided to push my application logs from locally hosted rsyslog server to Grafana Loki cloud. To push the logs to Grafana Loki, we need an agent which will run on the local host (where rsyslog is running) and push/stream the logs to Grafana Loki. The agent is called promtail.
Step 1:
We will need to first download the promtail. Go to Loki release page and look for promtail artifact for your CPU architecture. In my case, since I’m installing it on Raspberry pi, I will choose arm64 flavor - promtail-linux-arm64.zip. Download promtail, unzip and move the artifact to /usr/local/bin/promtail:
curl -O -L https://github.com/grafana/loki/releases/download/v2.9.1/promtail-linux-arm64.zip
unzip "promtail-linux-arm64.zip"
chmod a+x "promtail-linux-arm64"
sudo cp promtail-linux-arm64 /usr/local/bin/promtail
Step 2:
Now let’s create the promtail config file which will have the details for Grafana cloud connection and source for the logs which needs to be pushed to Grafana loki. Create a file named promtail-config.yaml in this location /etc/promtail. The content of the file should look like below (save the file):
server:
  http_listen_port: 9080
  grpc_listen_port: 0

positions:
  filename: /tmp/positions.yaml

clients:
  - url: https://logs-prod3.grafana.net/loki/api/v1/push
    basic_auth:
      username: xxxxxx
      password: xxxxxxx
scrape_configs:
  - job_name: system
    static_configs:
      - targets:
          - localhost
        labels:
          job: varlogs
          __path__: /var/log/pico.log
  - job_name: esp32
    static_configs:
      - targets:
          - localhost
        labels:
          job: varlogs
          __path__: /var/log/esp32carparking.log
server: http_listen_port: 9080:
This is the local port on which we can access promtail interface.
clients:
  - url: https://logs-prod3.grafana.net/loki/api/v1/push
    basic_auth:
      username: xxxxxx
      password: xxxxxx
url - is the Grafana loki’s host address.
basic_auth - is the user credentials for pushing logs to loki
  - job_name: system
    static_configs:
      - targets:
          - localhost
        labels:
          job: varlogs
          __path__: /var/log/pico.log
job_name under scrape_configs: - lists the logs which we want to push to Grafana loki.
Step 3:
Also create a directory called logs in the same location /etc/promtail. In this location promtail will write promtail related logs.
Step 4:
We will create promtail as service, so that it automatically starts on reboot of the host (raspberry pi in my case). Follow the below steps:
#Create a file called promtail.service
sudo nano /etc/systemd/system/promtail.service
Enter below in the promtail.service file:
[Unit]
Description=Promtail service
After=network.target

[Service]
Type=simple
User=root
ExecStart=/usr/local/bin/promtail -config.file /etc/promtail/promtail-config.yaml
Restart=on-failure
RestartSec=20
StandardOutput=append:/etc/promtail/logs/promtail.log
StandardError=append:/etc/promtail/logs/promtail.log

[Install]
WantedBy=multi-user.target
Run below commands:
sudo systemctl daemon-reload #To reload systemd
sudo systemctl start promtail #to start promtail
sudo systemctl status promtail #to check status
sudo systemctl restart promtail #to restart
sudo systemctl enable promtail.service #to enable the service
Now promtail is installed and configured to push/stream the logs from /var/log/xxxx which we defined in the rsyslog configuration file. You can navigate to the host where the promtail is running to view which targets/logs are being received by promtail - http://192.168.0.235:9080 (9080 is the default port).
🔝
GRAFANA LOKI:
Grafana Loki is the centralized log management system (similar to rsyslog). The reason I’m forwarding/streaming the logs from rsyslog to Grafana loki is so that I can view the logs from anywhere and have some alerting setup in Grafana.
Step 1:
As we saw above, we pass the grafana loki host url in the promtail’s configuration file #Step 2 under PROMTAIL above
clients:
  - url: https://logs-prod3.grafana.net/loki/api/v1/push
Step 2:
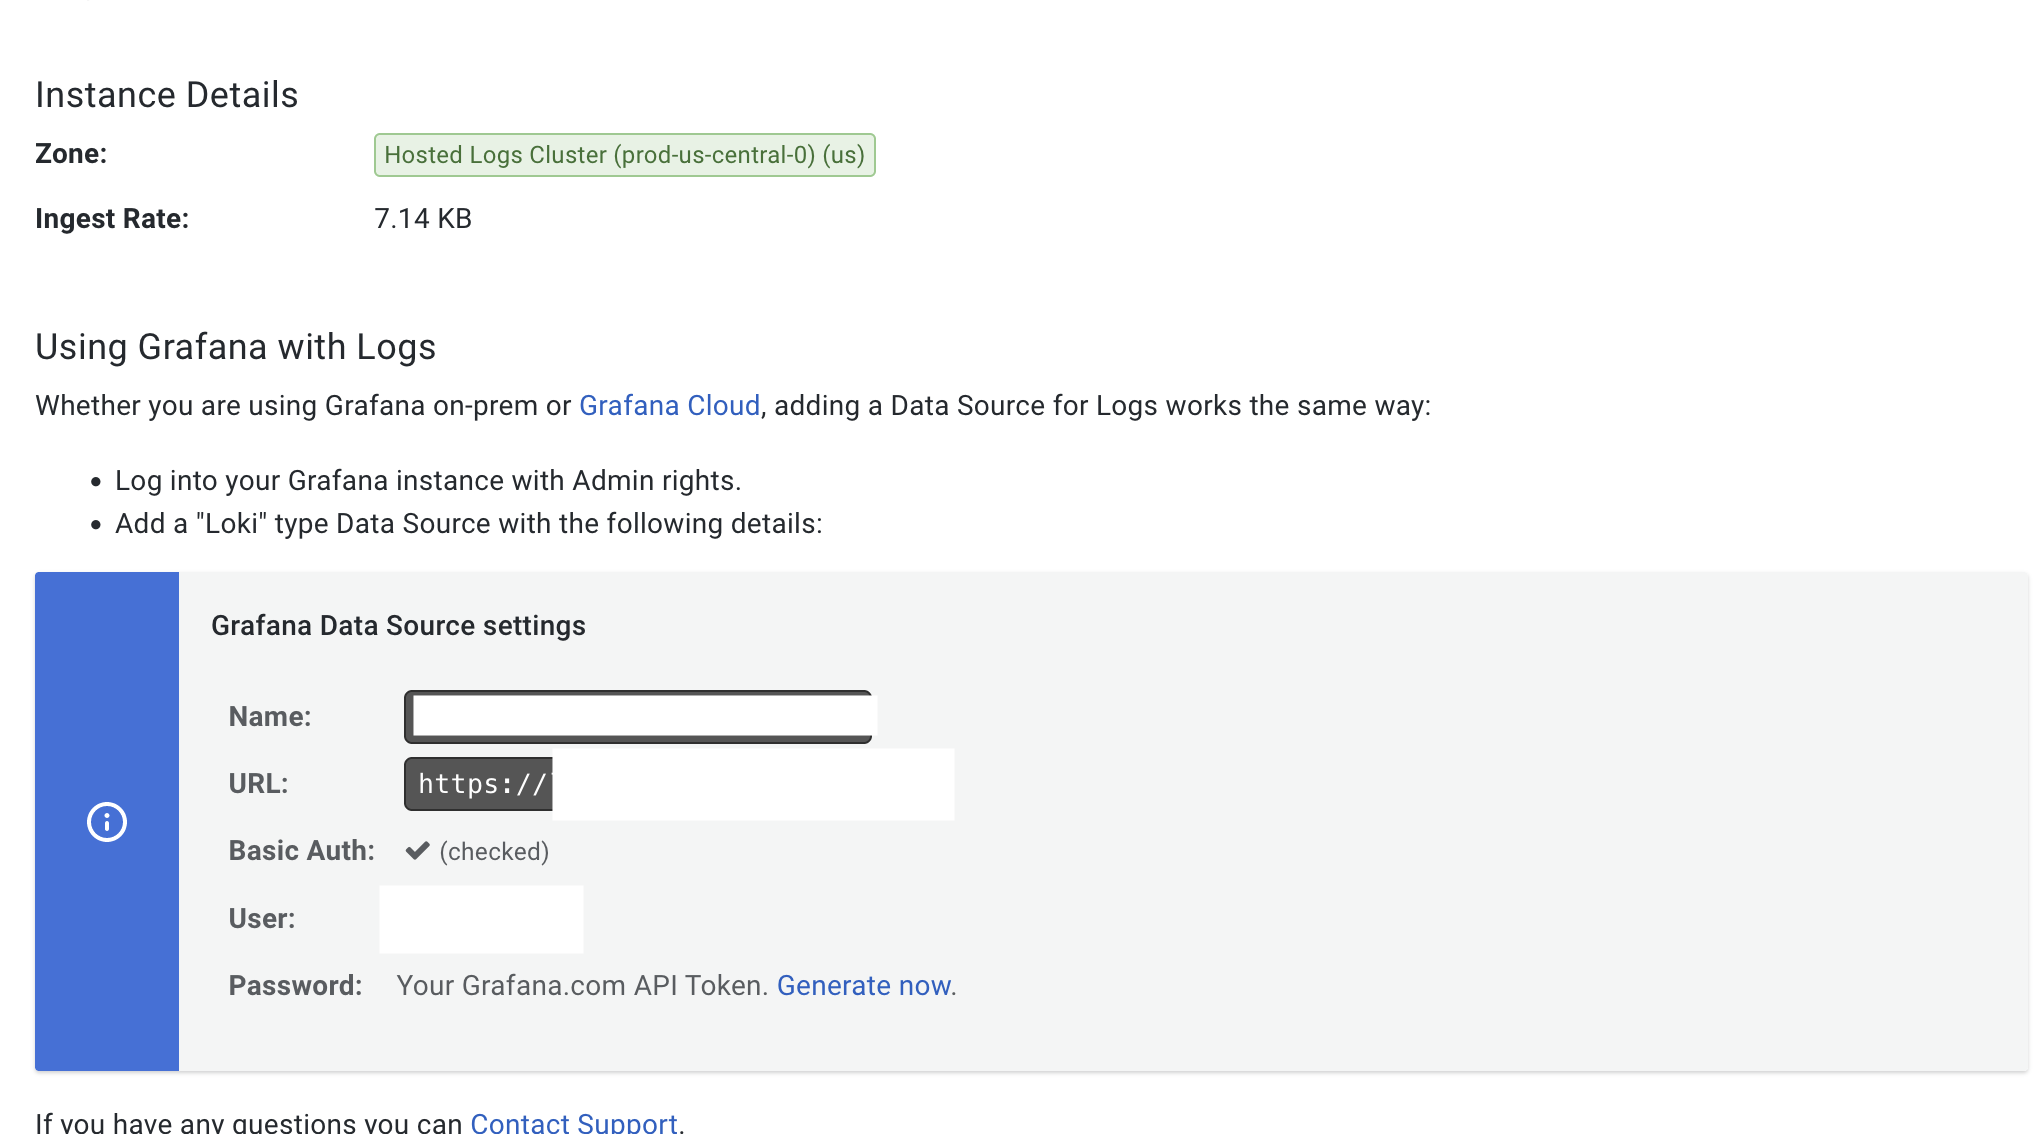
To get that, go to Grafana account > My Account. There you will see Loki. Click on Details. It will show the user id and host url (used in the above step). It would look like below.
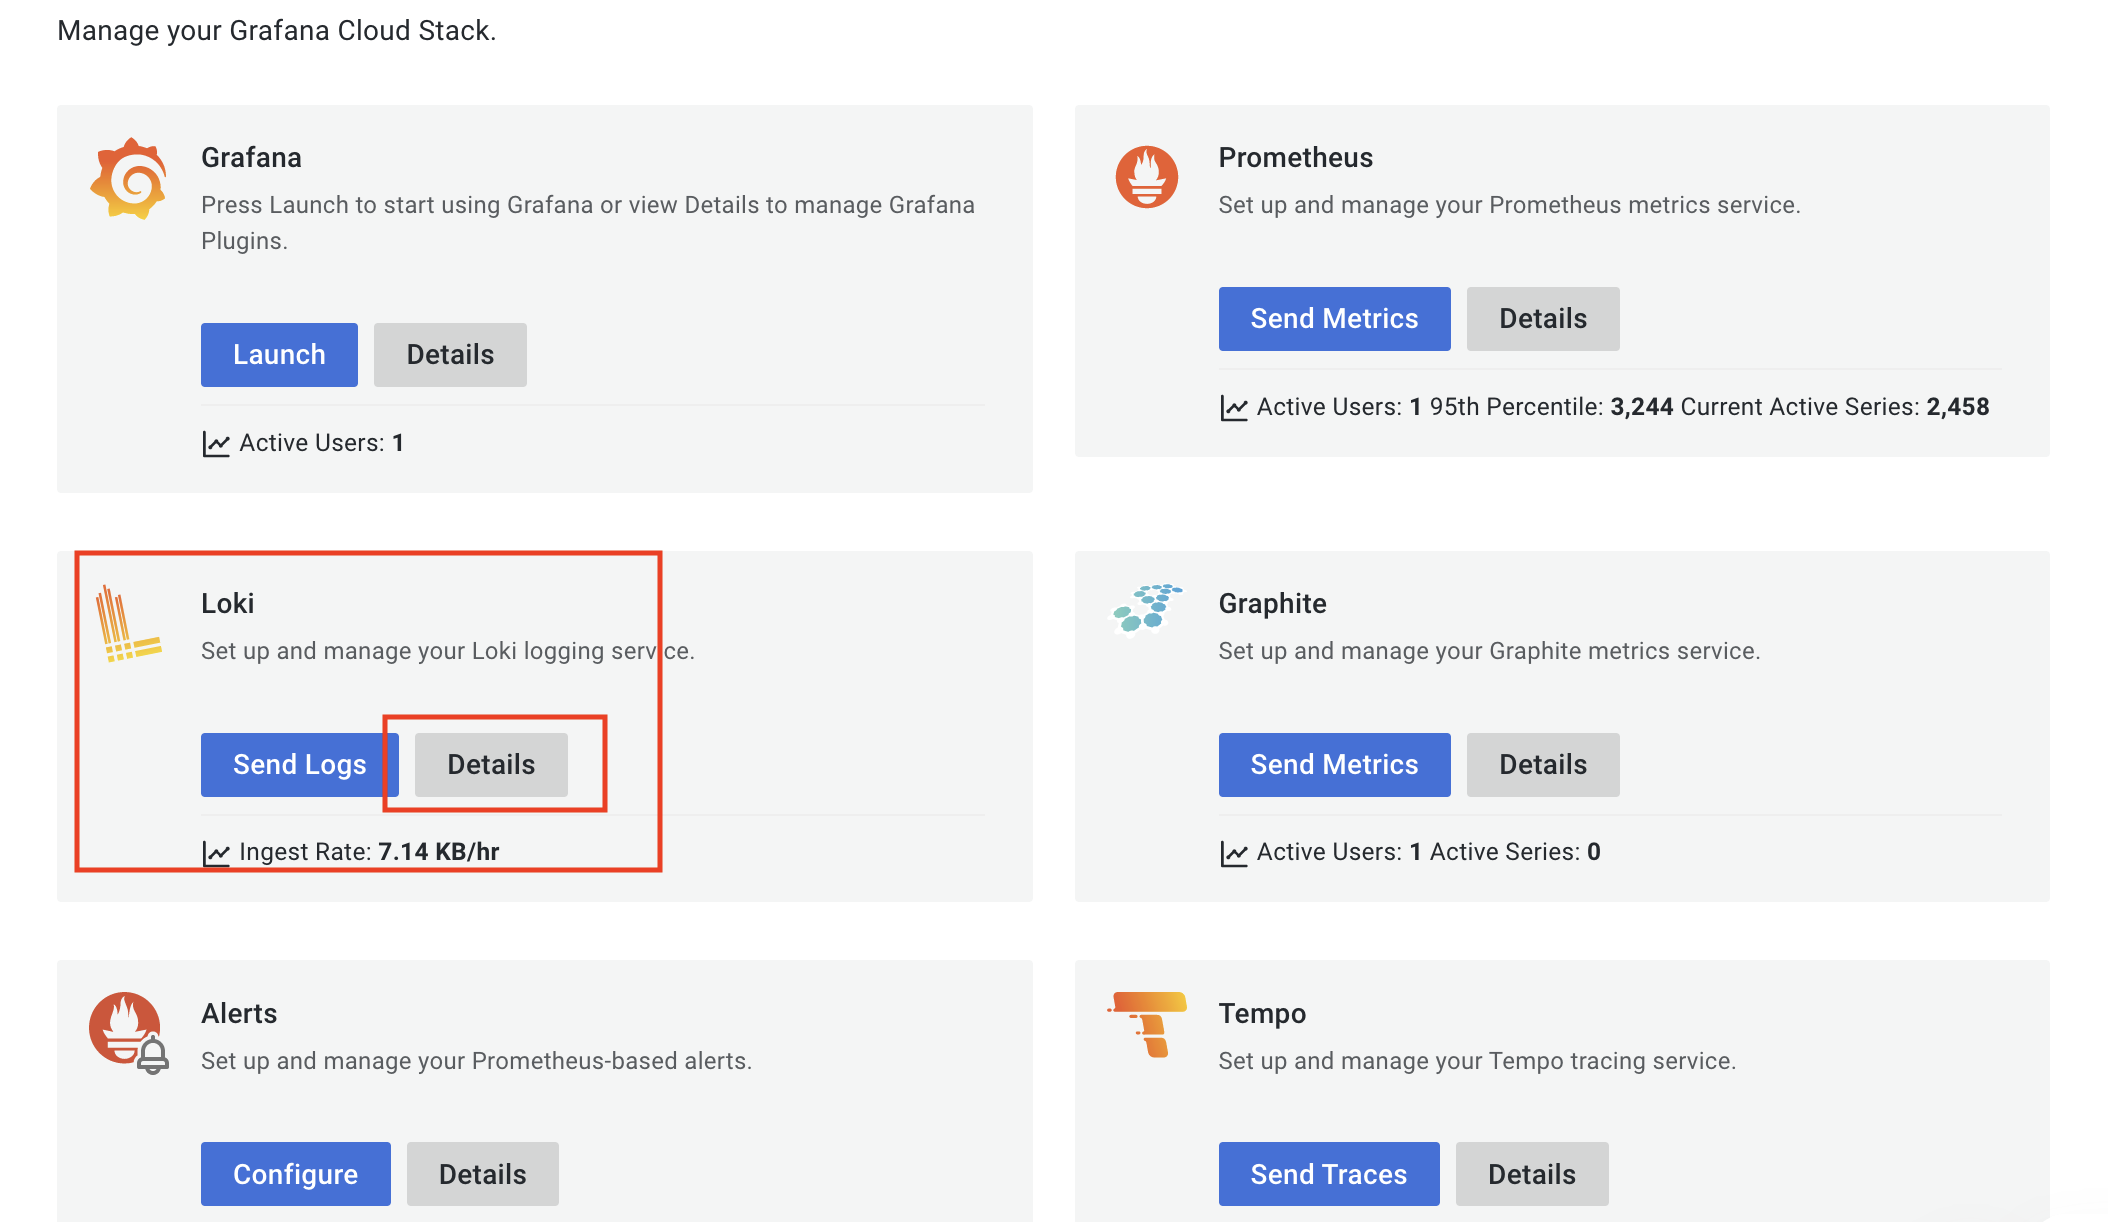
Click on Loki details.
Step 3:
Now, we need to generate password.
 basic_auth:
      username: xxxxxx
      password: xxxxxxx
scrape_configs:
In the same page as above choose Generate Now and choose create a new token manually. OR you can get the credentials from by logging into your Grafana account > My Account and create a new token manually - https://grafana.com/orgs/<your_user>/access-policies. Provide write access to logs for this new token that you are creating. I have provided all the access. The token you created now is the password. It should look like below. Copy the token and save it somewhere (it won’t be visible later).
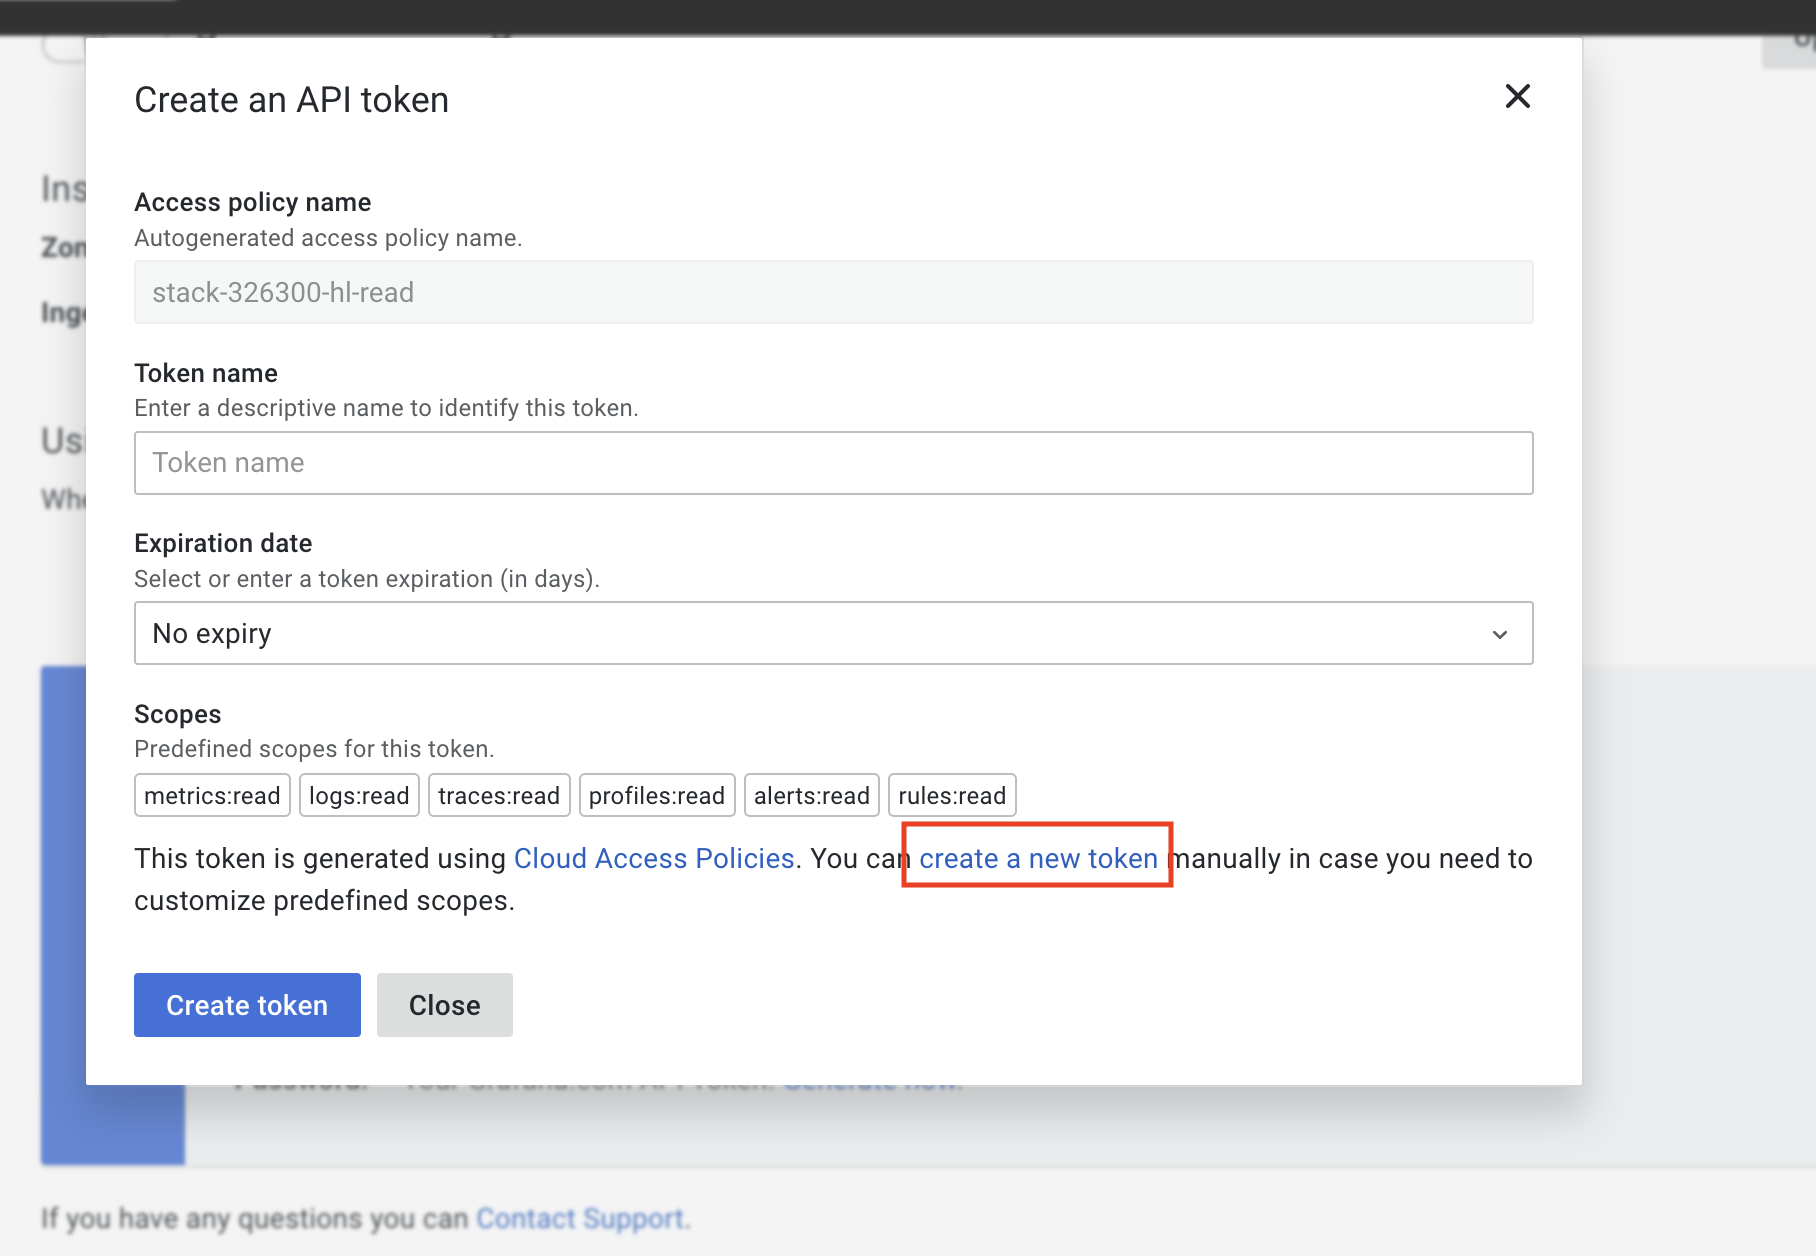
Creating a new manual token
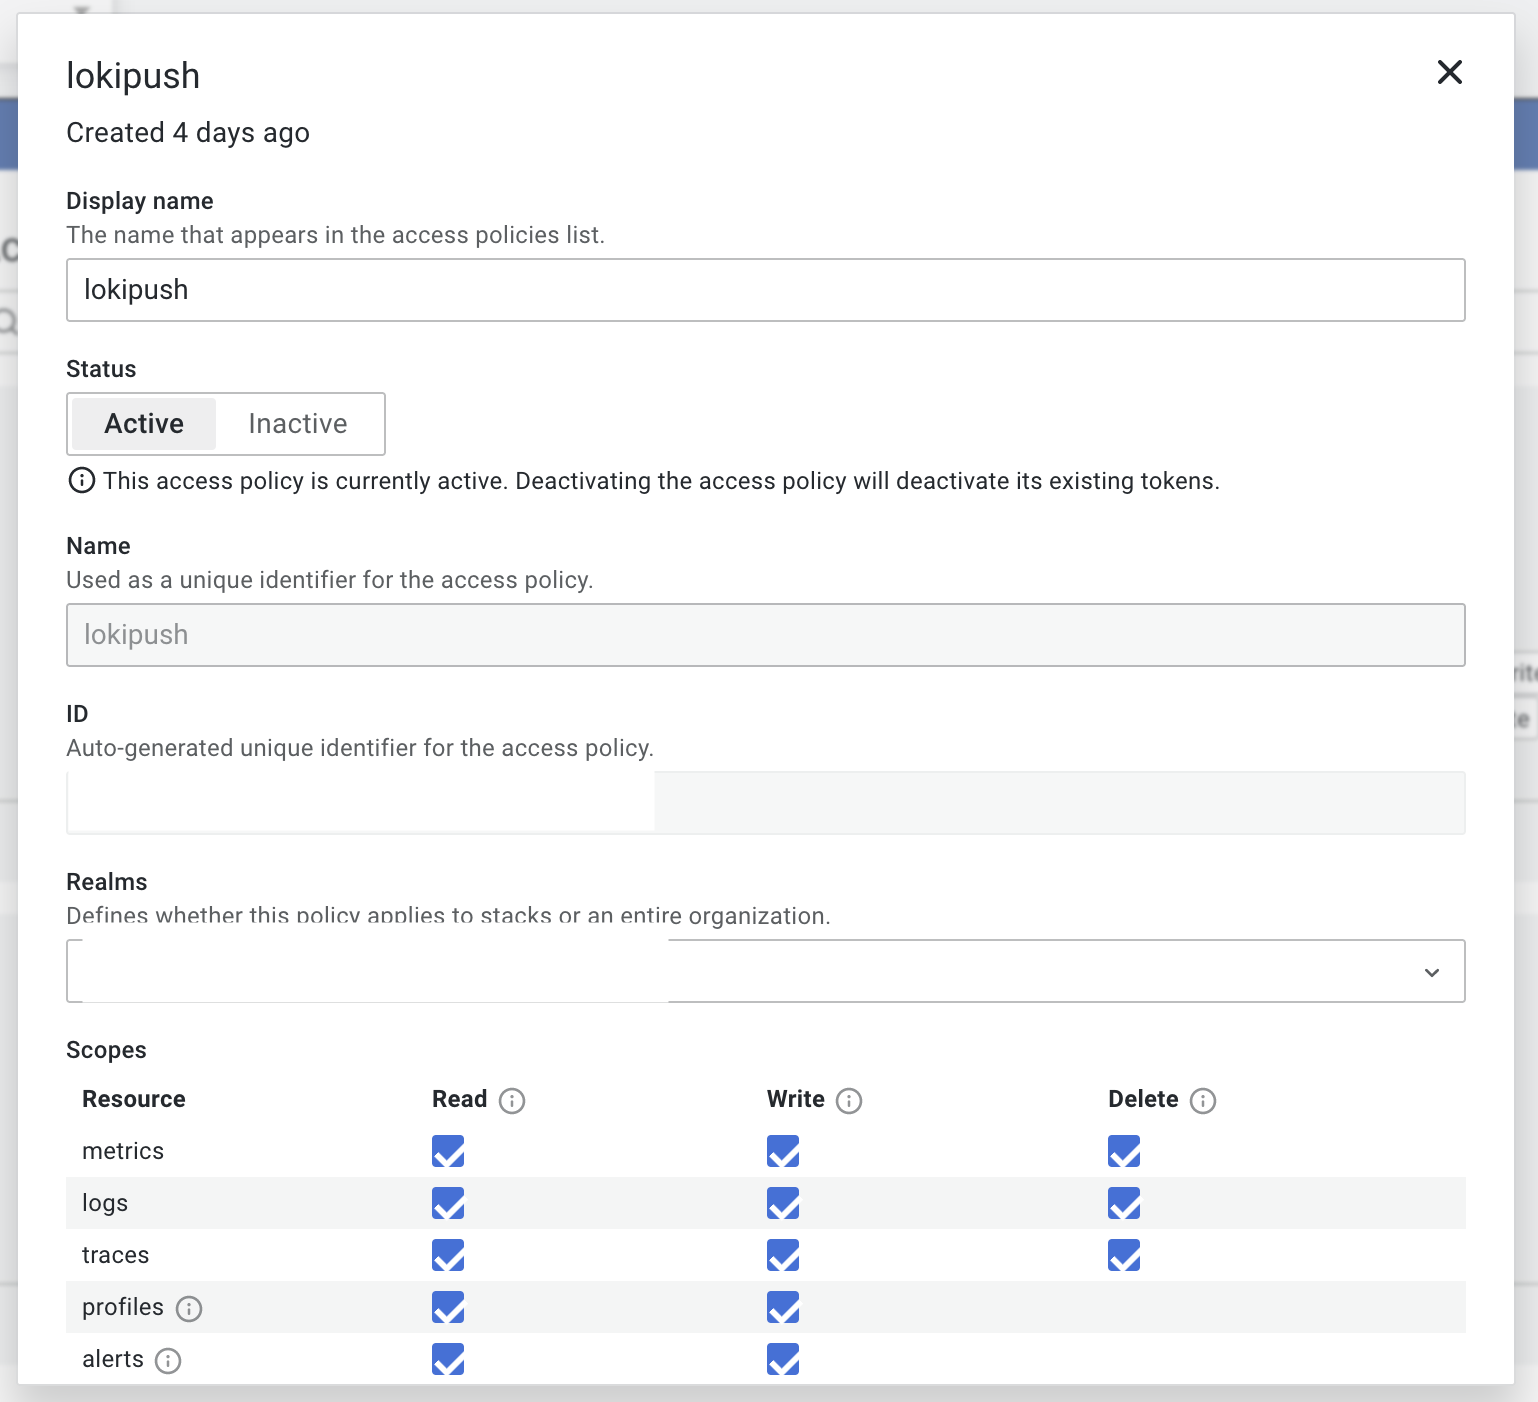
Permissions should look like this.
Grafana loki is now ready to start receiving logs from our rsyslog server.
Step 4:
You can click on Explore on the left panel in your dashboard view and choose loki datasource and should start seeing the logs.
🔝
CODE:
I’m using Syslog library in my code to write logs to rsyslog server. Check out the comments in the code snippet below on what needs to be done to push logs to rsyslog server.
#include <Syslog.h>

// Syslog server connection info hosted locally. This is the IP address and port for rsyslog server where the logs will be sent
#define SYSLOG_SERVER "192.168.0.235" //rsyslog server IP
#define SYSLOG_PORT 514 //rsyslog server port

// Syslog logging details
#define DEVICE_HOSTNAME "esp32" //name of the device, which you will see in the logs
#define APP_NAME "carDetector" //this is like logger name which you will see in the logs

// A UDP instance to let us send and receive packets over UDP (this is needed for sending logs to rsyslog)
WiFiUDP udpClient; // the logs are sent to rsyslog server as UDP packets, so need this object

// Create a new syslog instance with LOG_KERN facility (this is needed for sending logs to rsyslog)
Syslog syslog(udpClient, SYSLOG_SERVER, SYSLOG_PORT, DEVICE_HOSTNAME, APP_NAME, LOG_KERN); //creating `syslog` which we will use in our code for logging


int main()
{
    init(); // this is needed for arduino platform

    Serial.begin( 9600 ); // starting Serial with baud rate 9600

    for ( ;; )
    //some logging examples at INFO and ERROR level
        syslog.log(LOG_INFO, "Distance measure is more than 0.4ft, will send the new distance"); //info level logging text
        syslog.logf(LOG_INFO, "car1 distance %d", 4); // info level logging with text and interger value
        syslog.log(LOG_ERR, "Failed connectiong to the MQTT broker, will try again in 5 seconds"); // error level logging
        delay(5000); //delay for 5 seconds
}
SCREEN CAPTURES:
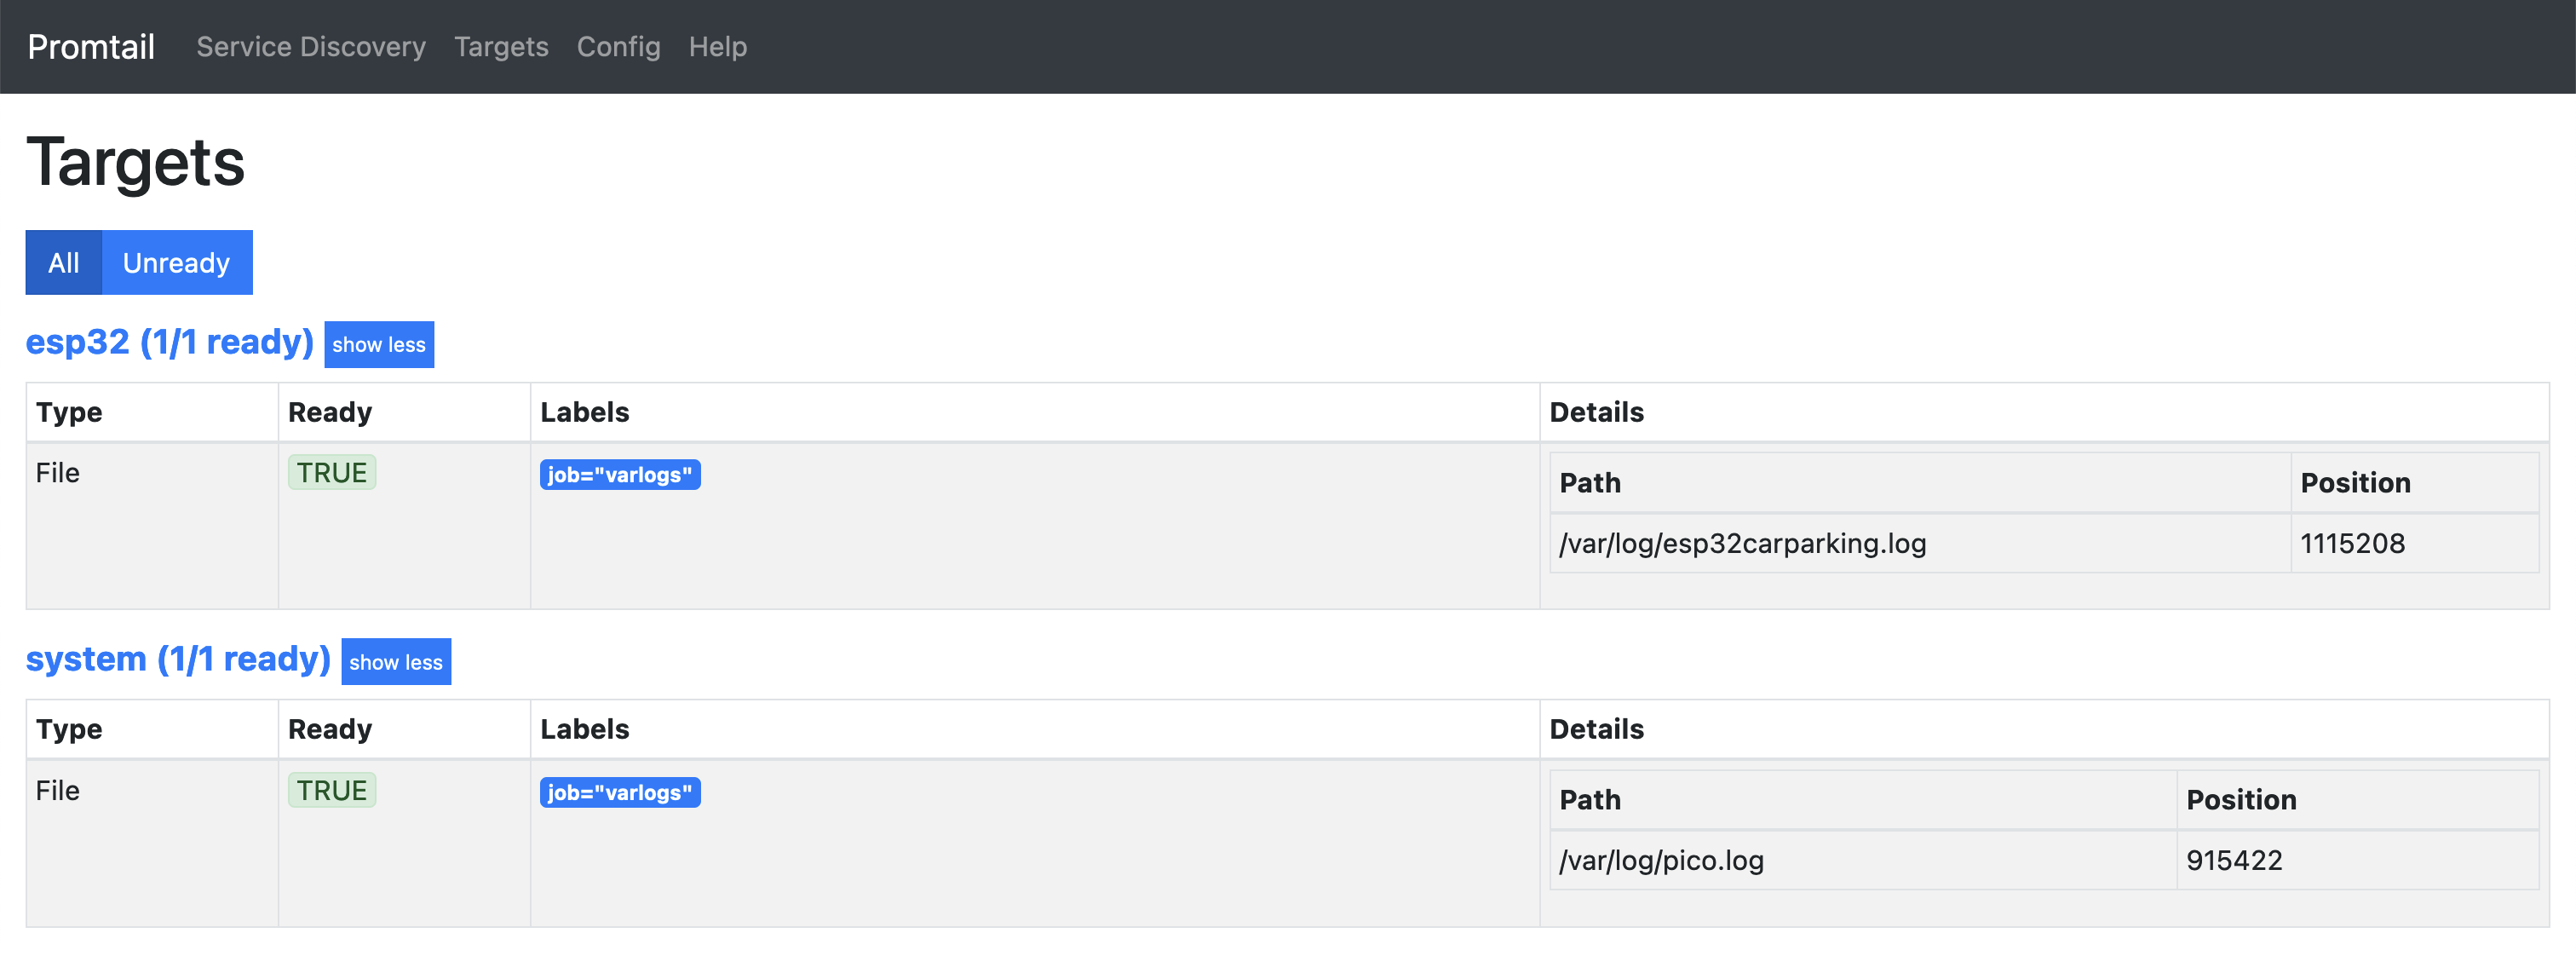 This is the screen capture from my locally hosted promtal interface, which lists all the logs which it receving from other hosts.
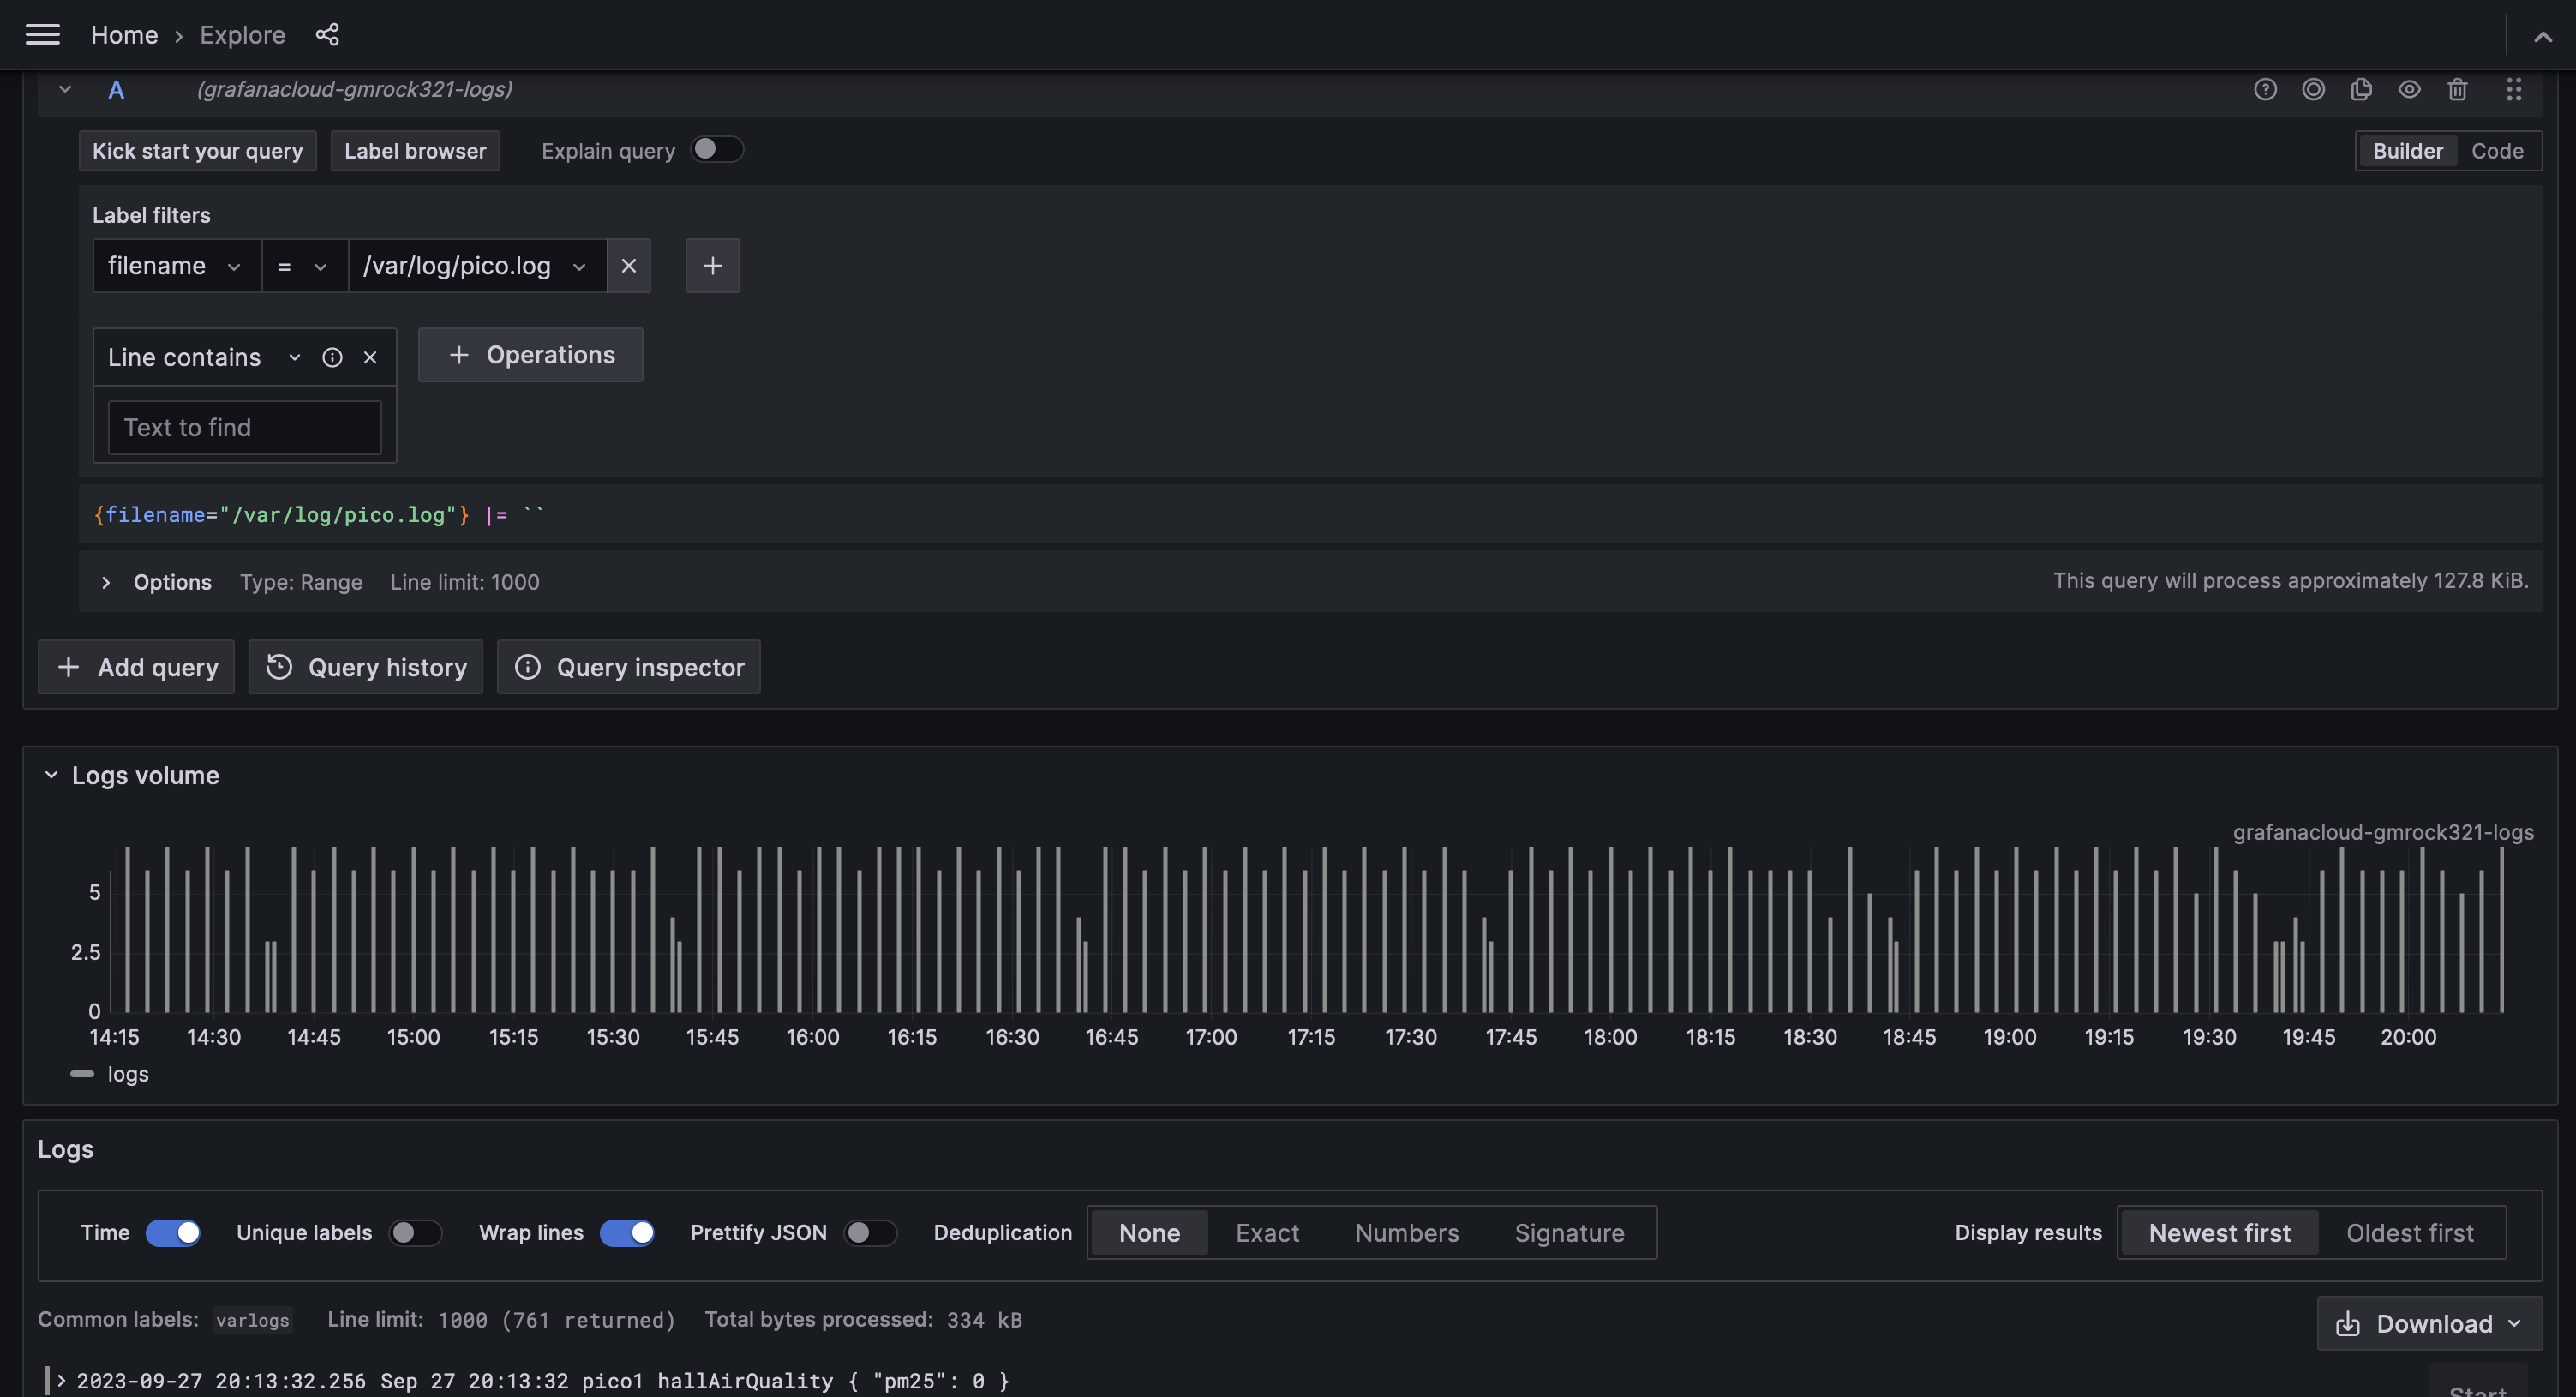
This is the Explore view in Grafana which allows to query the logs in real time.
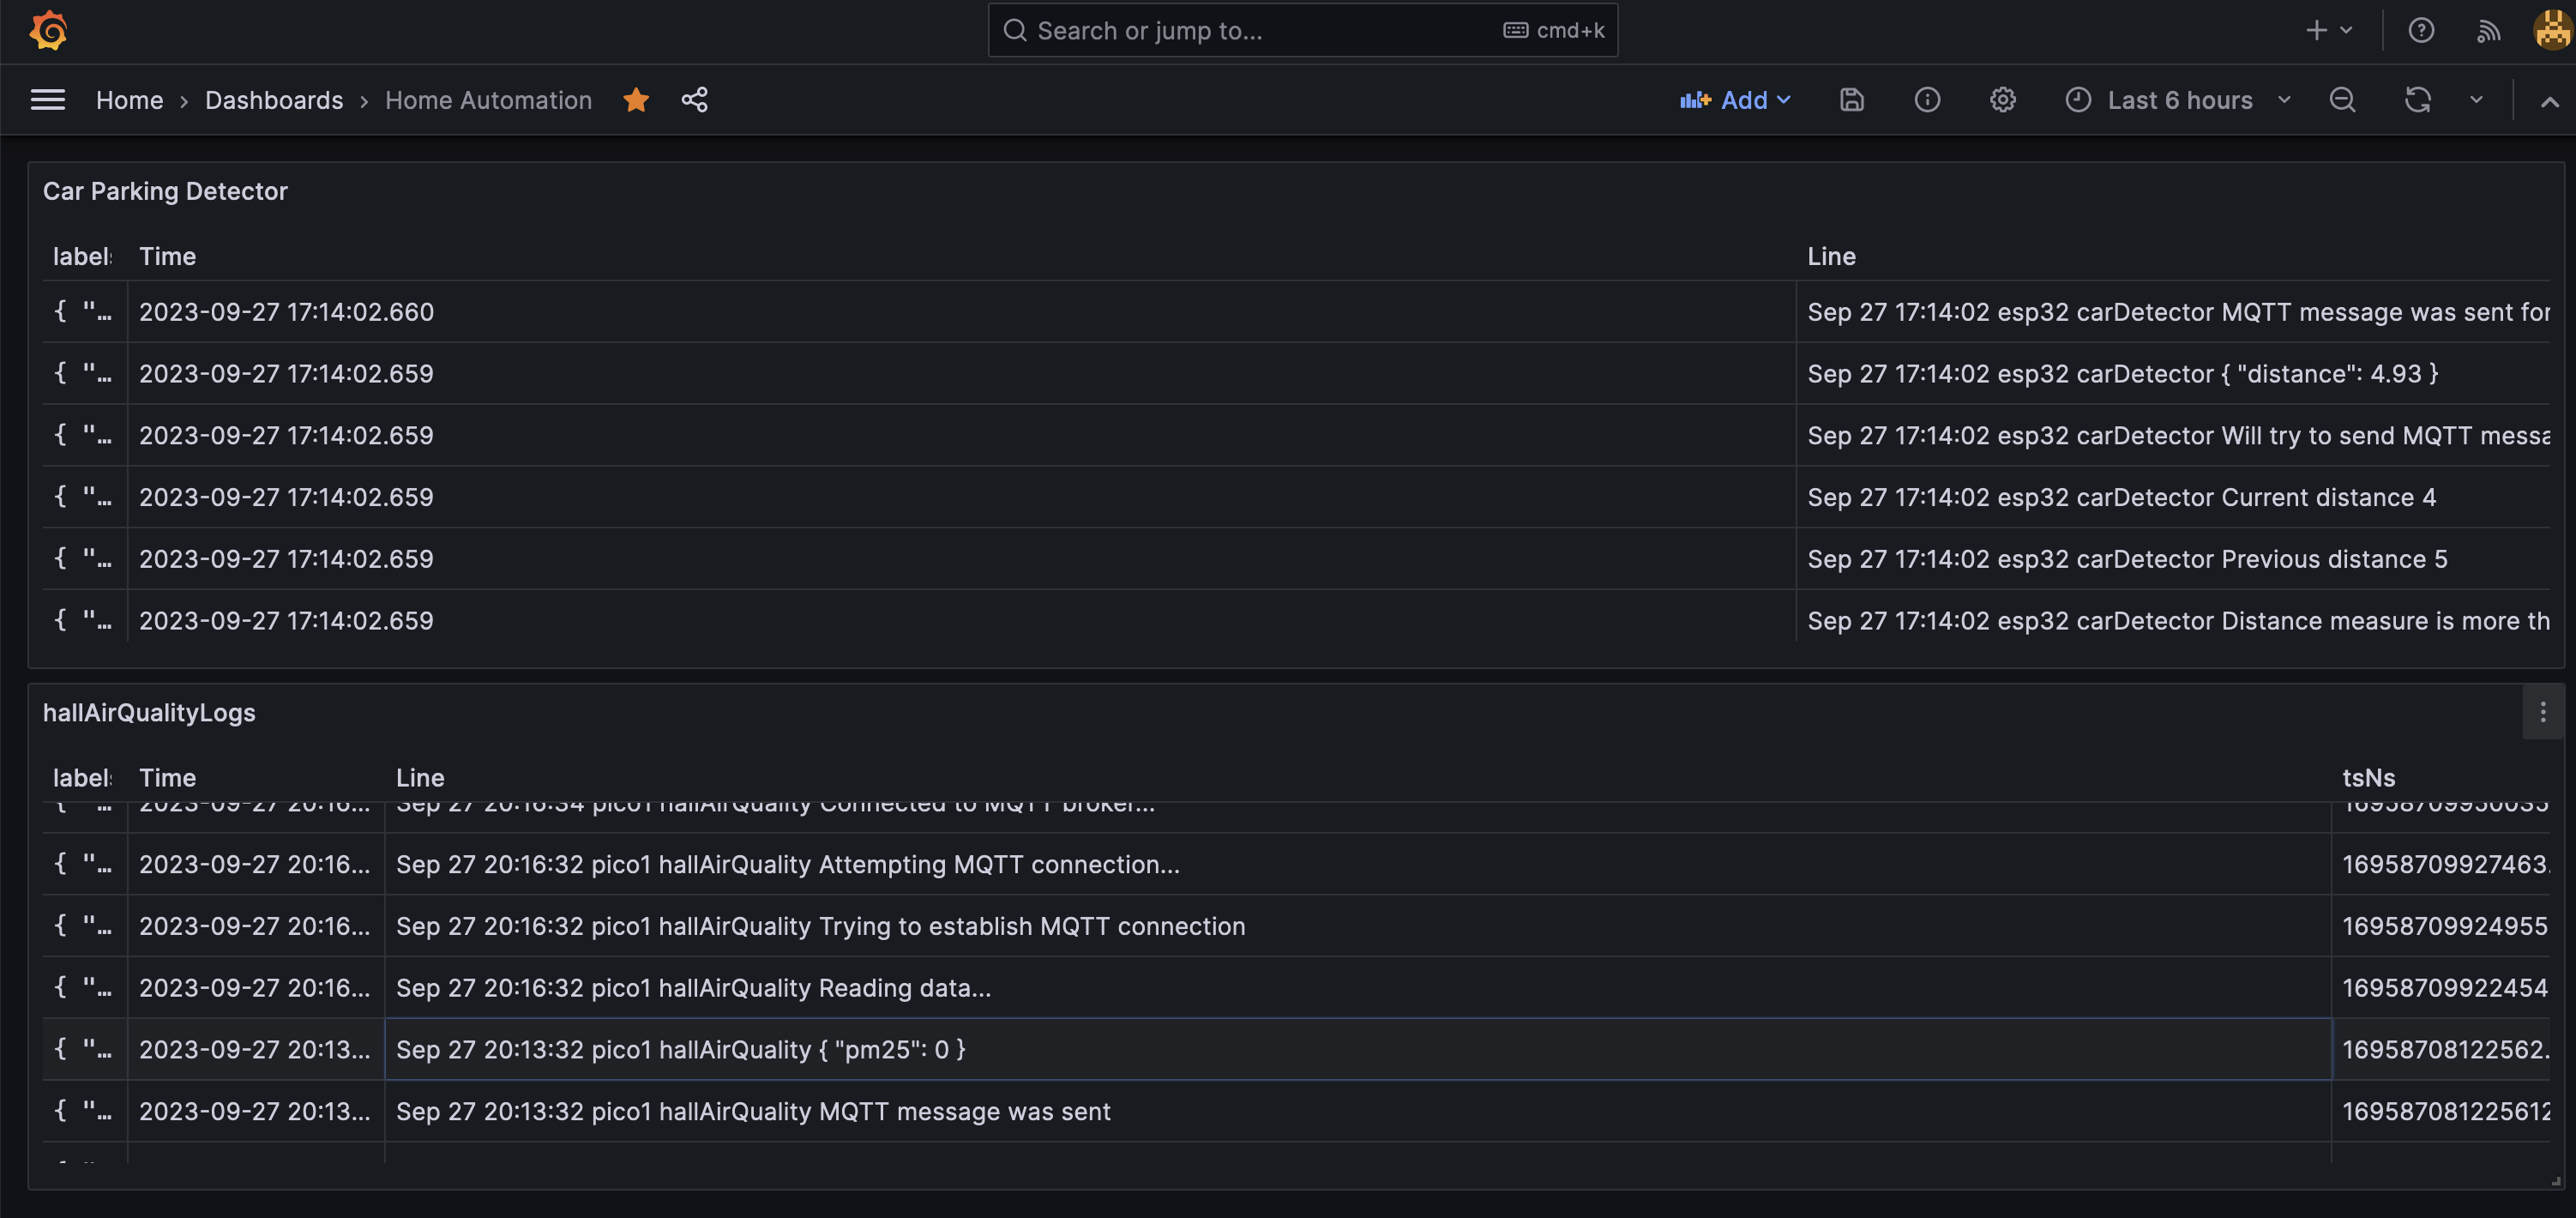
This is the dashboard which I have created that displays the logs in real time (and also historical data)
REFERENCES:
Below are some of the articles and videos which were helpful in setting up rsyslog, promtail and loki
- rsyslog: https://pimylifeup.com/raspberry-pi-syslog-server/
- promtail: https://psujit775.medium.com/how-to-setup-promtail-in-ubuntu-20-04-ed652b7c47c3
- grafana loki: https://www.youtube.com/watch?v=Tnj9EOmak0A
🔝